debugr▮
a native debugger that lives in your browser — built in Rust, UI in Vue
Attach to a running process (or launch one, or open its core dump) and watch it: image buffers render as actual images while the program runs, container internals decode to their real values, and every number on screen is a live watch — re-resolved from the variable's name on every read, so nothing goes stale.
see your data, not your bytes
A render buffer is a picture, so show the picture
Attached to a running C++ path tracer. An image watch on
s_Instance.m_LayerStack[0].m_Renderer.m_ImageData pulls the framebuffer out of
the live process and renders it — an 820×614 viewport streaming at 12 Hz. No
instrumentation in the target, no snapshot button: the pixels are read straight out of its
memory, so you watch the render converge frame by frame as it accumulates samples.
follow the pointer to the real thing
Drill through smart pointers to the object that's actually there
That buffer lives four hops deep — a std::vector<std::shared_ptr<Layer>>,
a unique_ptr<Renderer>, another shared_ptr. debugr decodes
libstdc++ containers with use counts, and follows a shared_ptr<Layer> to the
real MainLayer behind it — vtable-resolved, print object done automatically —
so the path lands on the derived fields instead of a base-class stub.
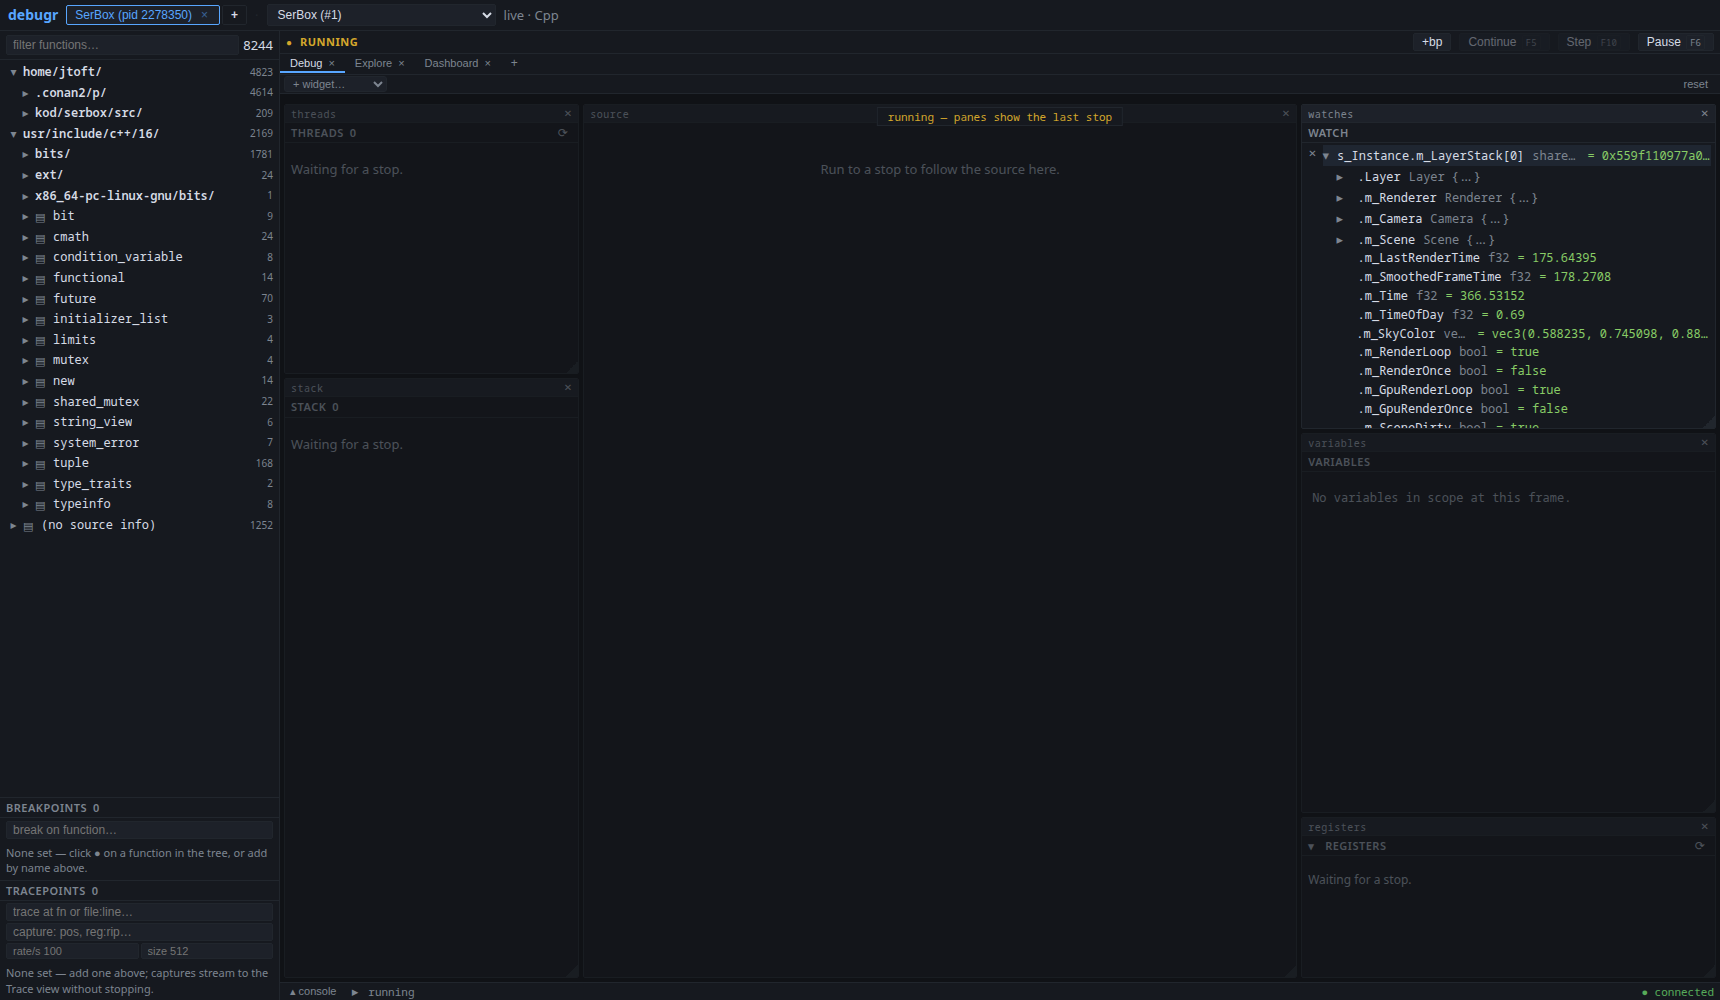
the whole watch story on one screen
Compose the workbench from widgets
Every panel — source, disassembly, charts, images, symbol tables — is a widget on a grid surface you arrange yourself. Right-click a number and chart it while the process runs; right-click a buffer and pin it as an image. Open as many as you like, tab multiple surfaces, and put one on each monitor: two browser windows share one session.
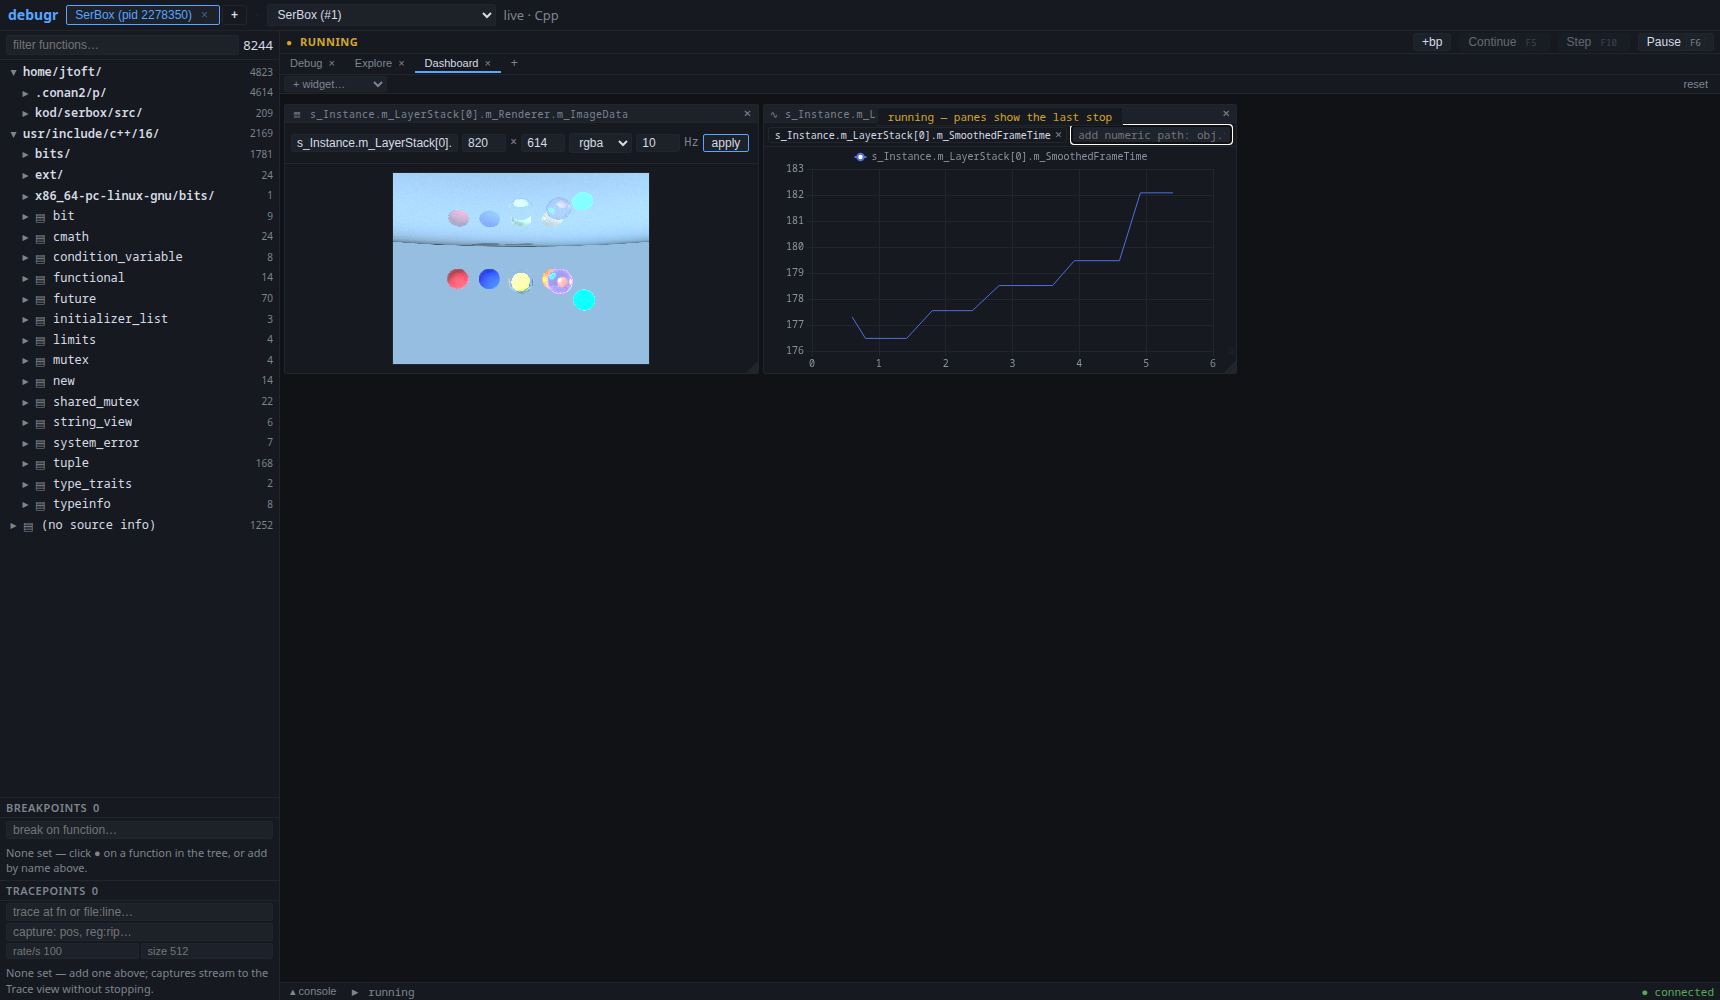
pin memory to the screen
An image watch follows a moving heap buffer
Type a pointer path and the framebuffer behind it renders as pixels, live, while the process runs. The path is re-resolved on every read — when the heap buffer moves (this target reallocates it every few seconds, including mid-clip below), the watch follows it, and after you rebuild and re-run, it re-binds by name. The stop-state panes dim on continue while the watch keeps streaming: it shows live memory, so it stays lit.
write, don't just read
Double-click a value and set it
A watch is not read-only. Double-click a value to edit it: g_pixels[2] = 0xdeadbeef
resolves through the same pointer path, encodes per the DWARF type, size-checks it, and
pokes the live process — the next read shows the change. Leaves only; a type mismatch or an
out-of-bounds index fails loudly without touching memory.
teach it your types
Container knowledge is a sandboxed WASM plugin
The libstdc++ decoding ships in-tree for speed, but it's just the built-in of a plugin interface. A data-model plugin makes a container iterable, a handle dereferenceable, an element addressable — always returning real addresses and types, never pre-rendered text. That one invariant is why traversal, image watches, and the write path all compose on top of a type debugr has never seen — the CV north star: your proprietary image buffers, first-class.
// what a value IS, structurally — addresses, never rendered text
interface data-model {
    summarize: func(value: value-info) -> option<string>;
    children:  func(value: value-info) -> option<child-set>;
    deref:     func(value: value-info) -> option<target>;
}
// child-set = sequence{addr, count, elem-type} | named{(name, addr, type)…}
tracepoints — debugging without stopping
The trajectory of a moving value, charted live
A tracepoint is a breakpoint that doesn't stop: each hit captures the values you asked for
and streams them over a WebSocket while the process runs at full speed. The XY view draws
the captured path, and the ledger says exactly what you got —
captured · hits · dropped, never a silent gap. One click records the
unthrottled stream to compressed parquet and loads it back for replay.
one place for the whole binary
Static analysis, tiled and coherent
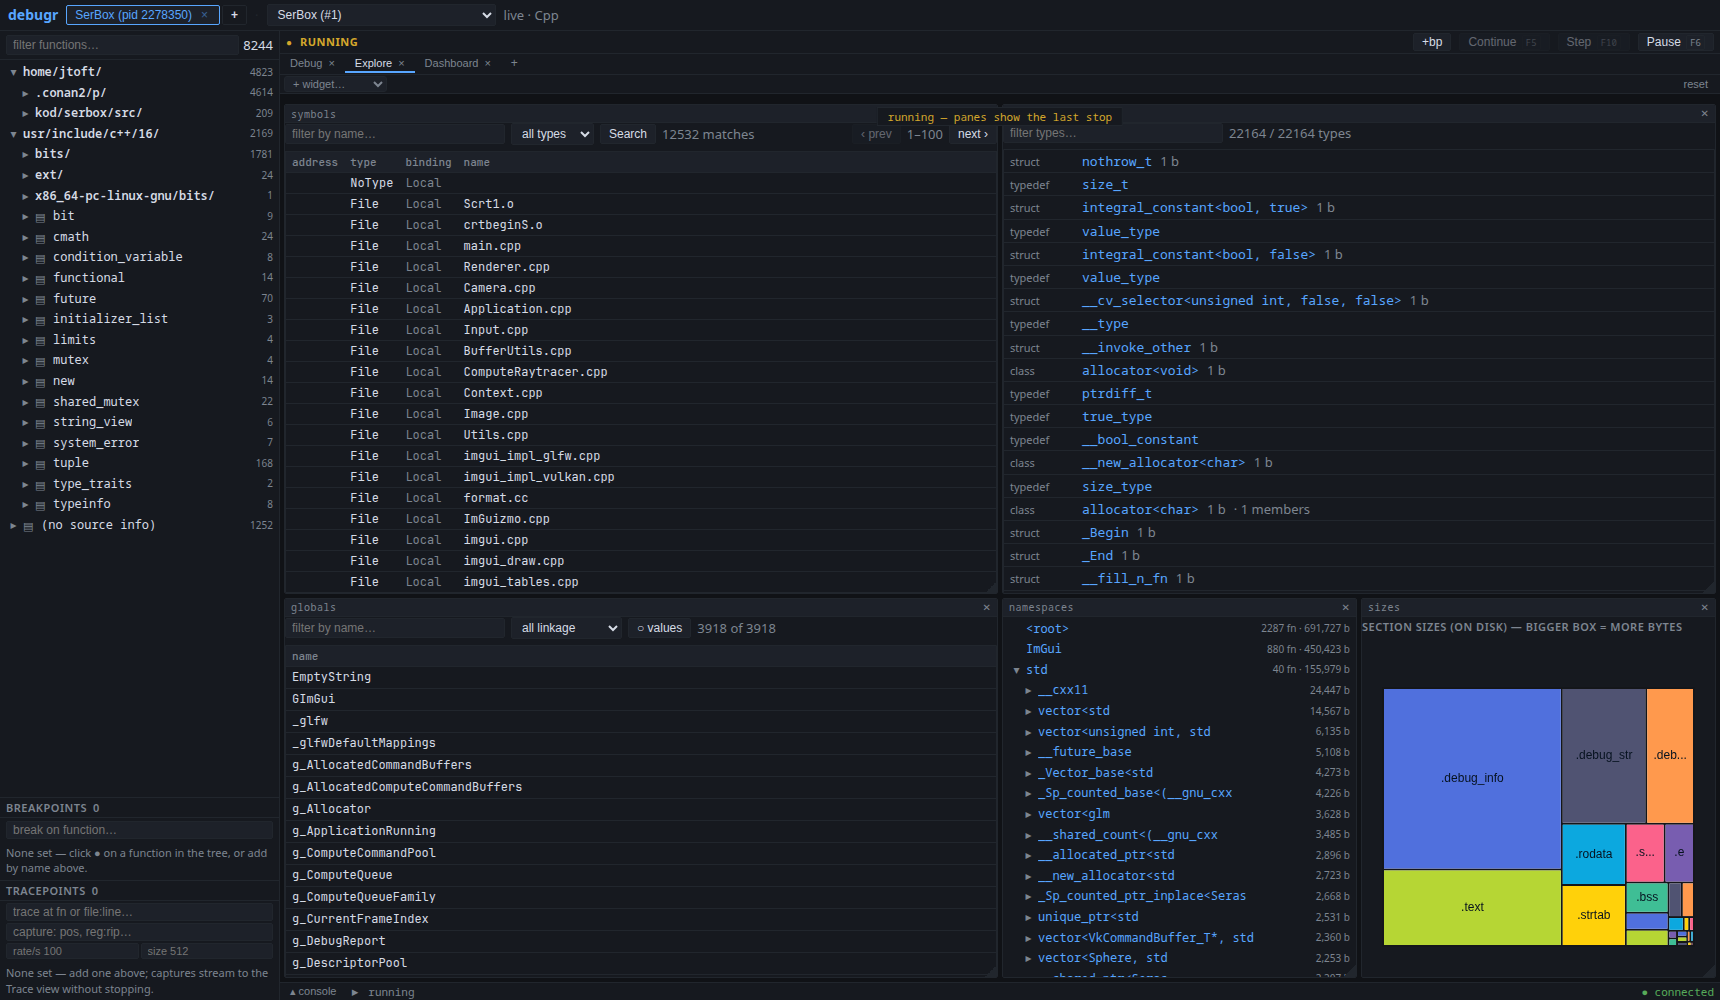
Symbols, types, globals, namespaces, and a section-size treemap — the ELF/DWARF explorer, as widgets on one surface. Every name is a demangled entity with the same right-click menu wherever it appears: a function goes to source or takes a breakpoint, a global becomes a watch, an address opens in hex. If you can read it, you can act on it.
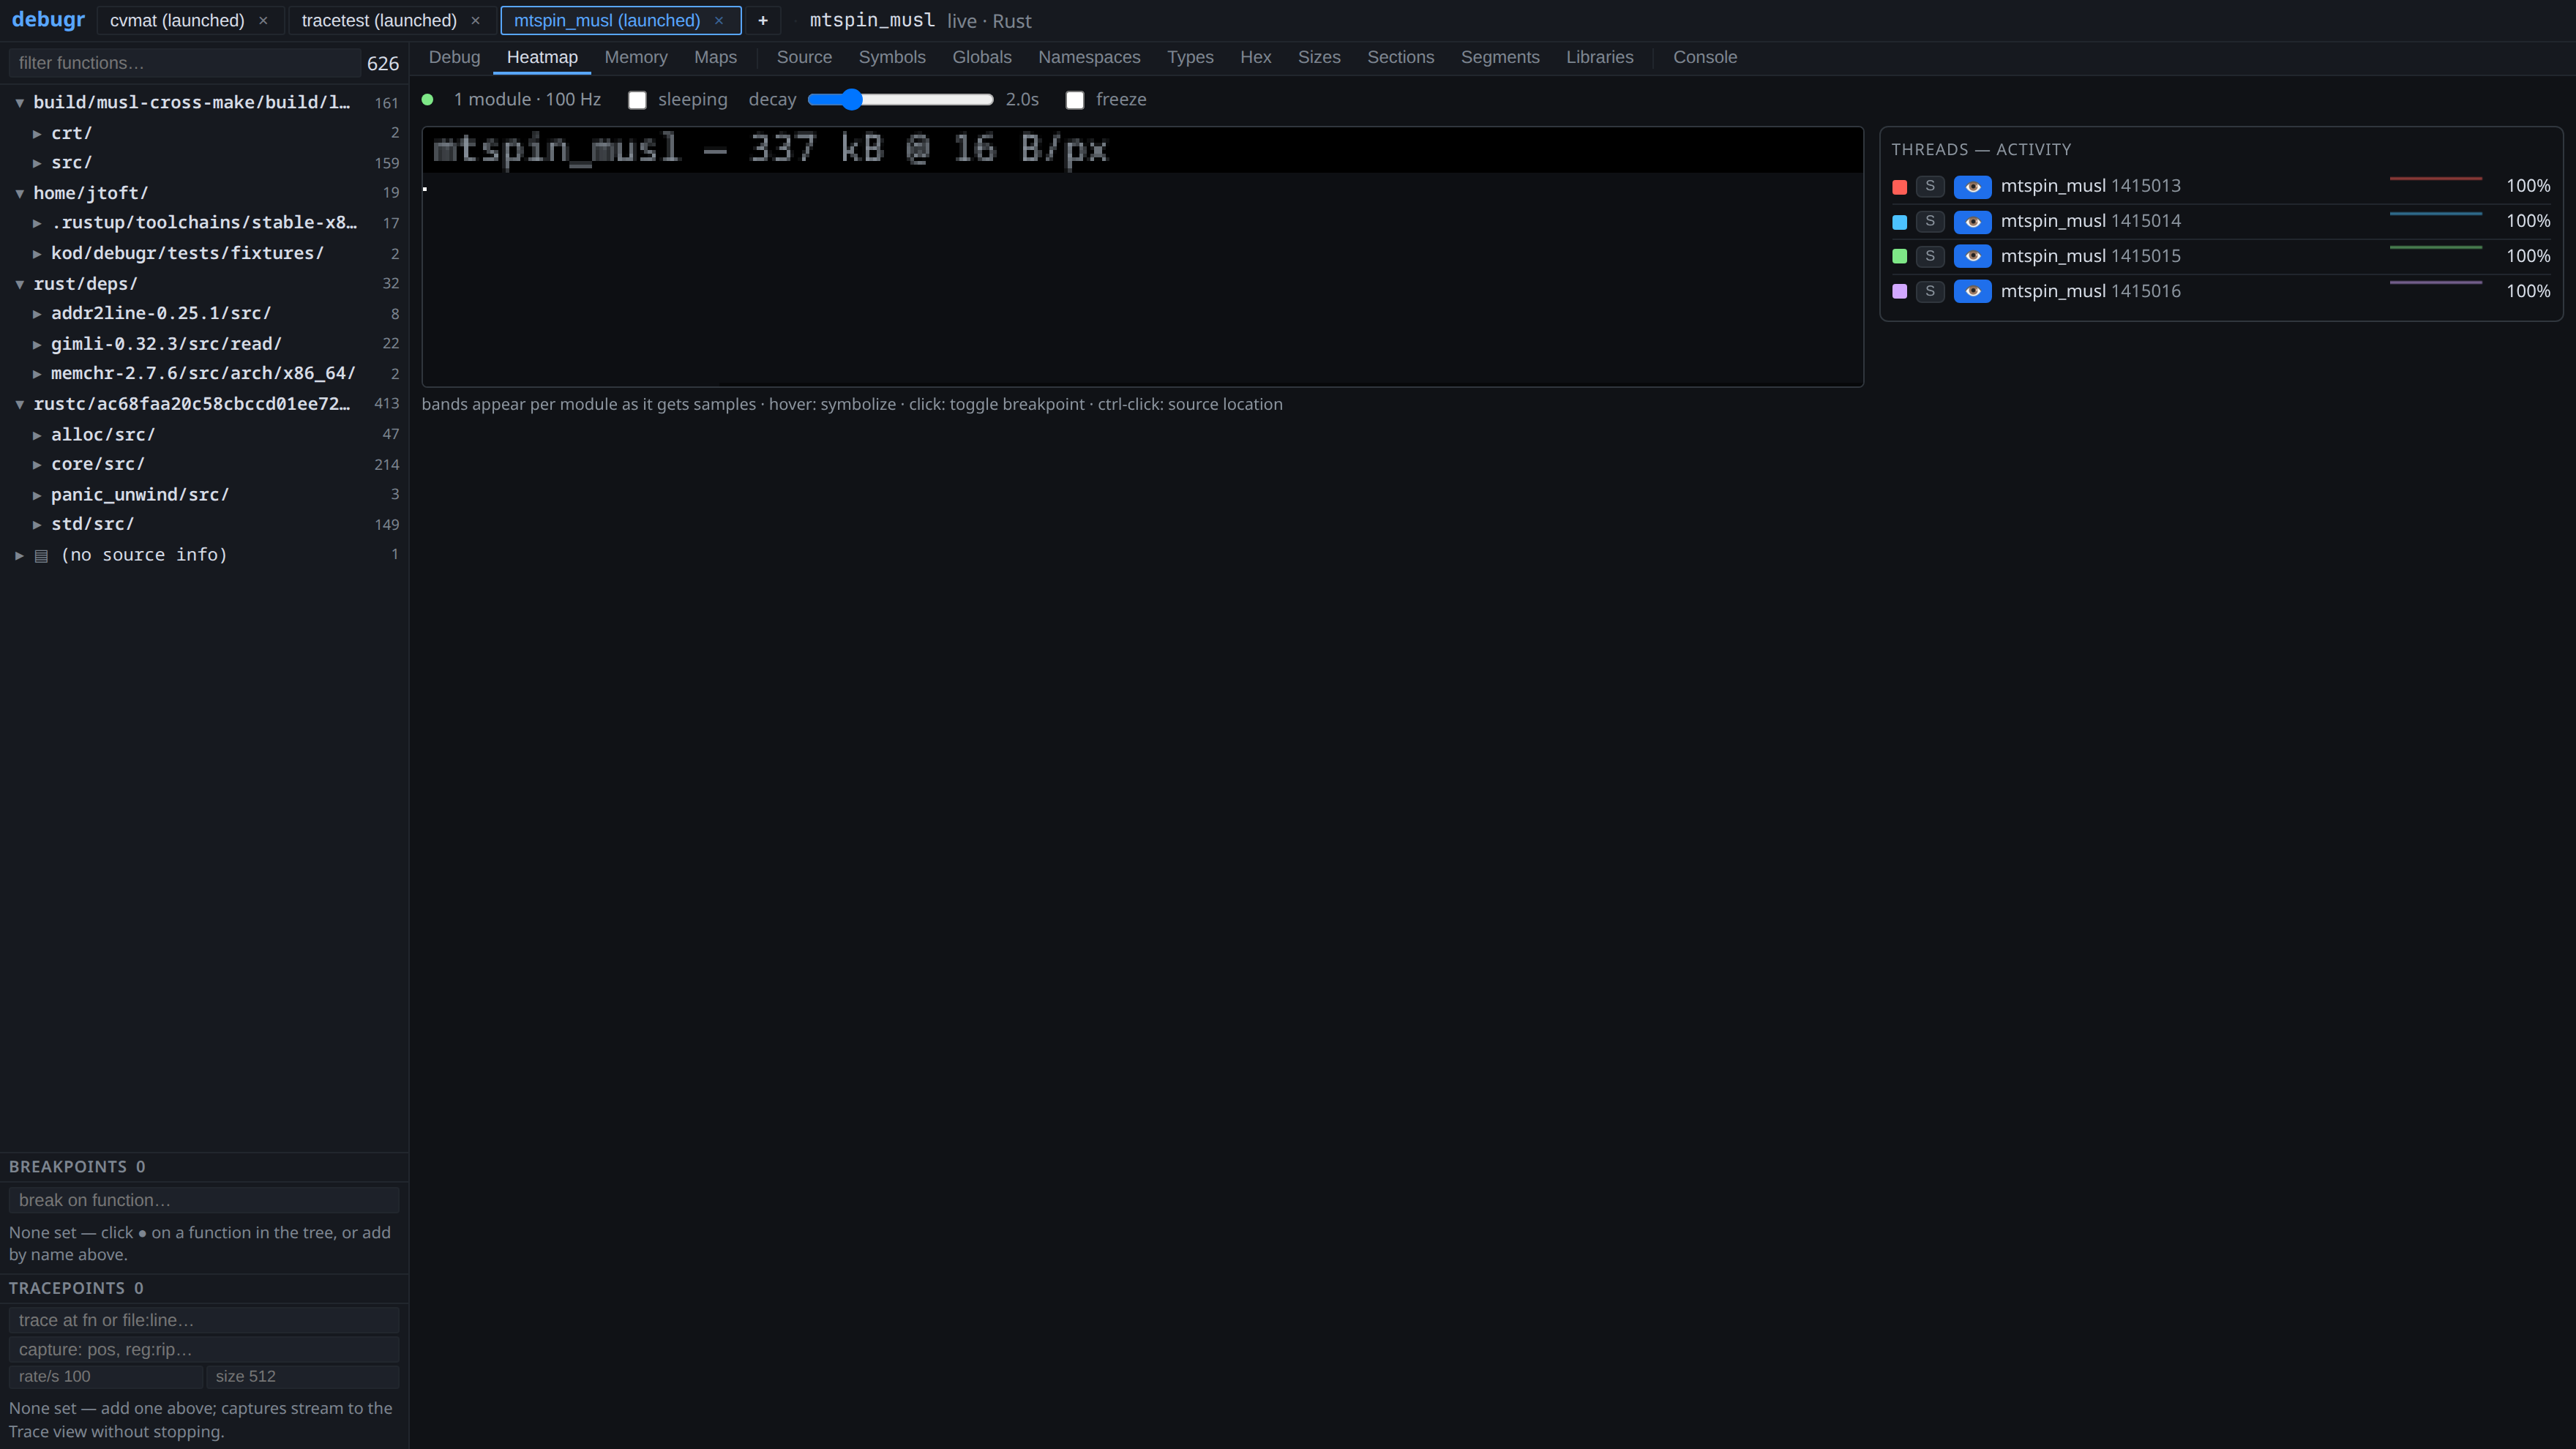
where is it spending time?
Live code heatmap, per thread
PC sampling paints heat over the binary's code segment while per-thread sparklines show activity. Click a hot spot to drop a breakpoint on it.
post-mortem
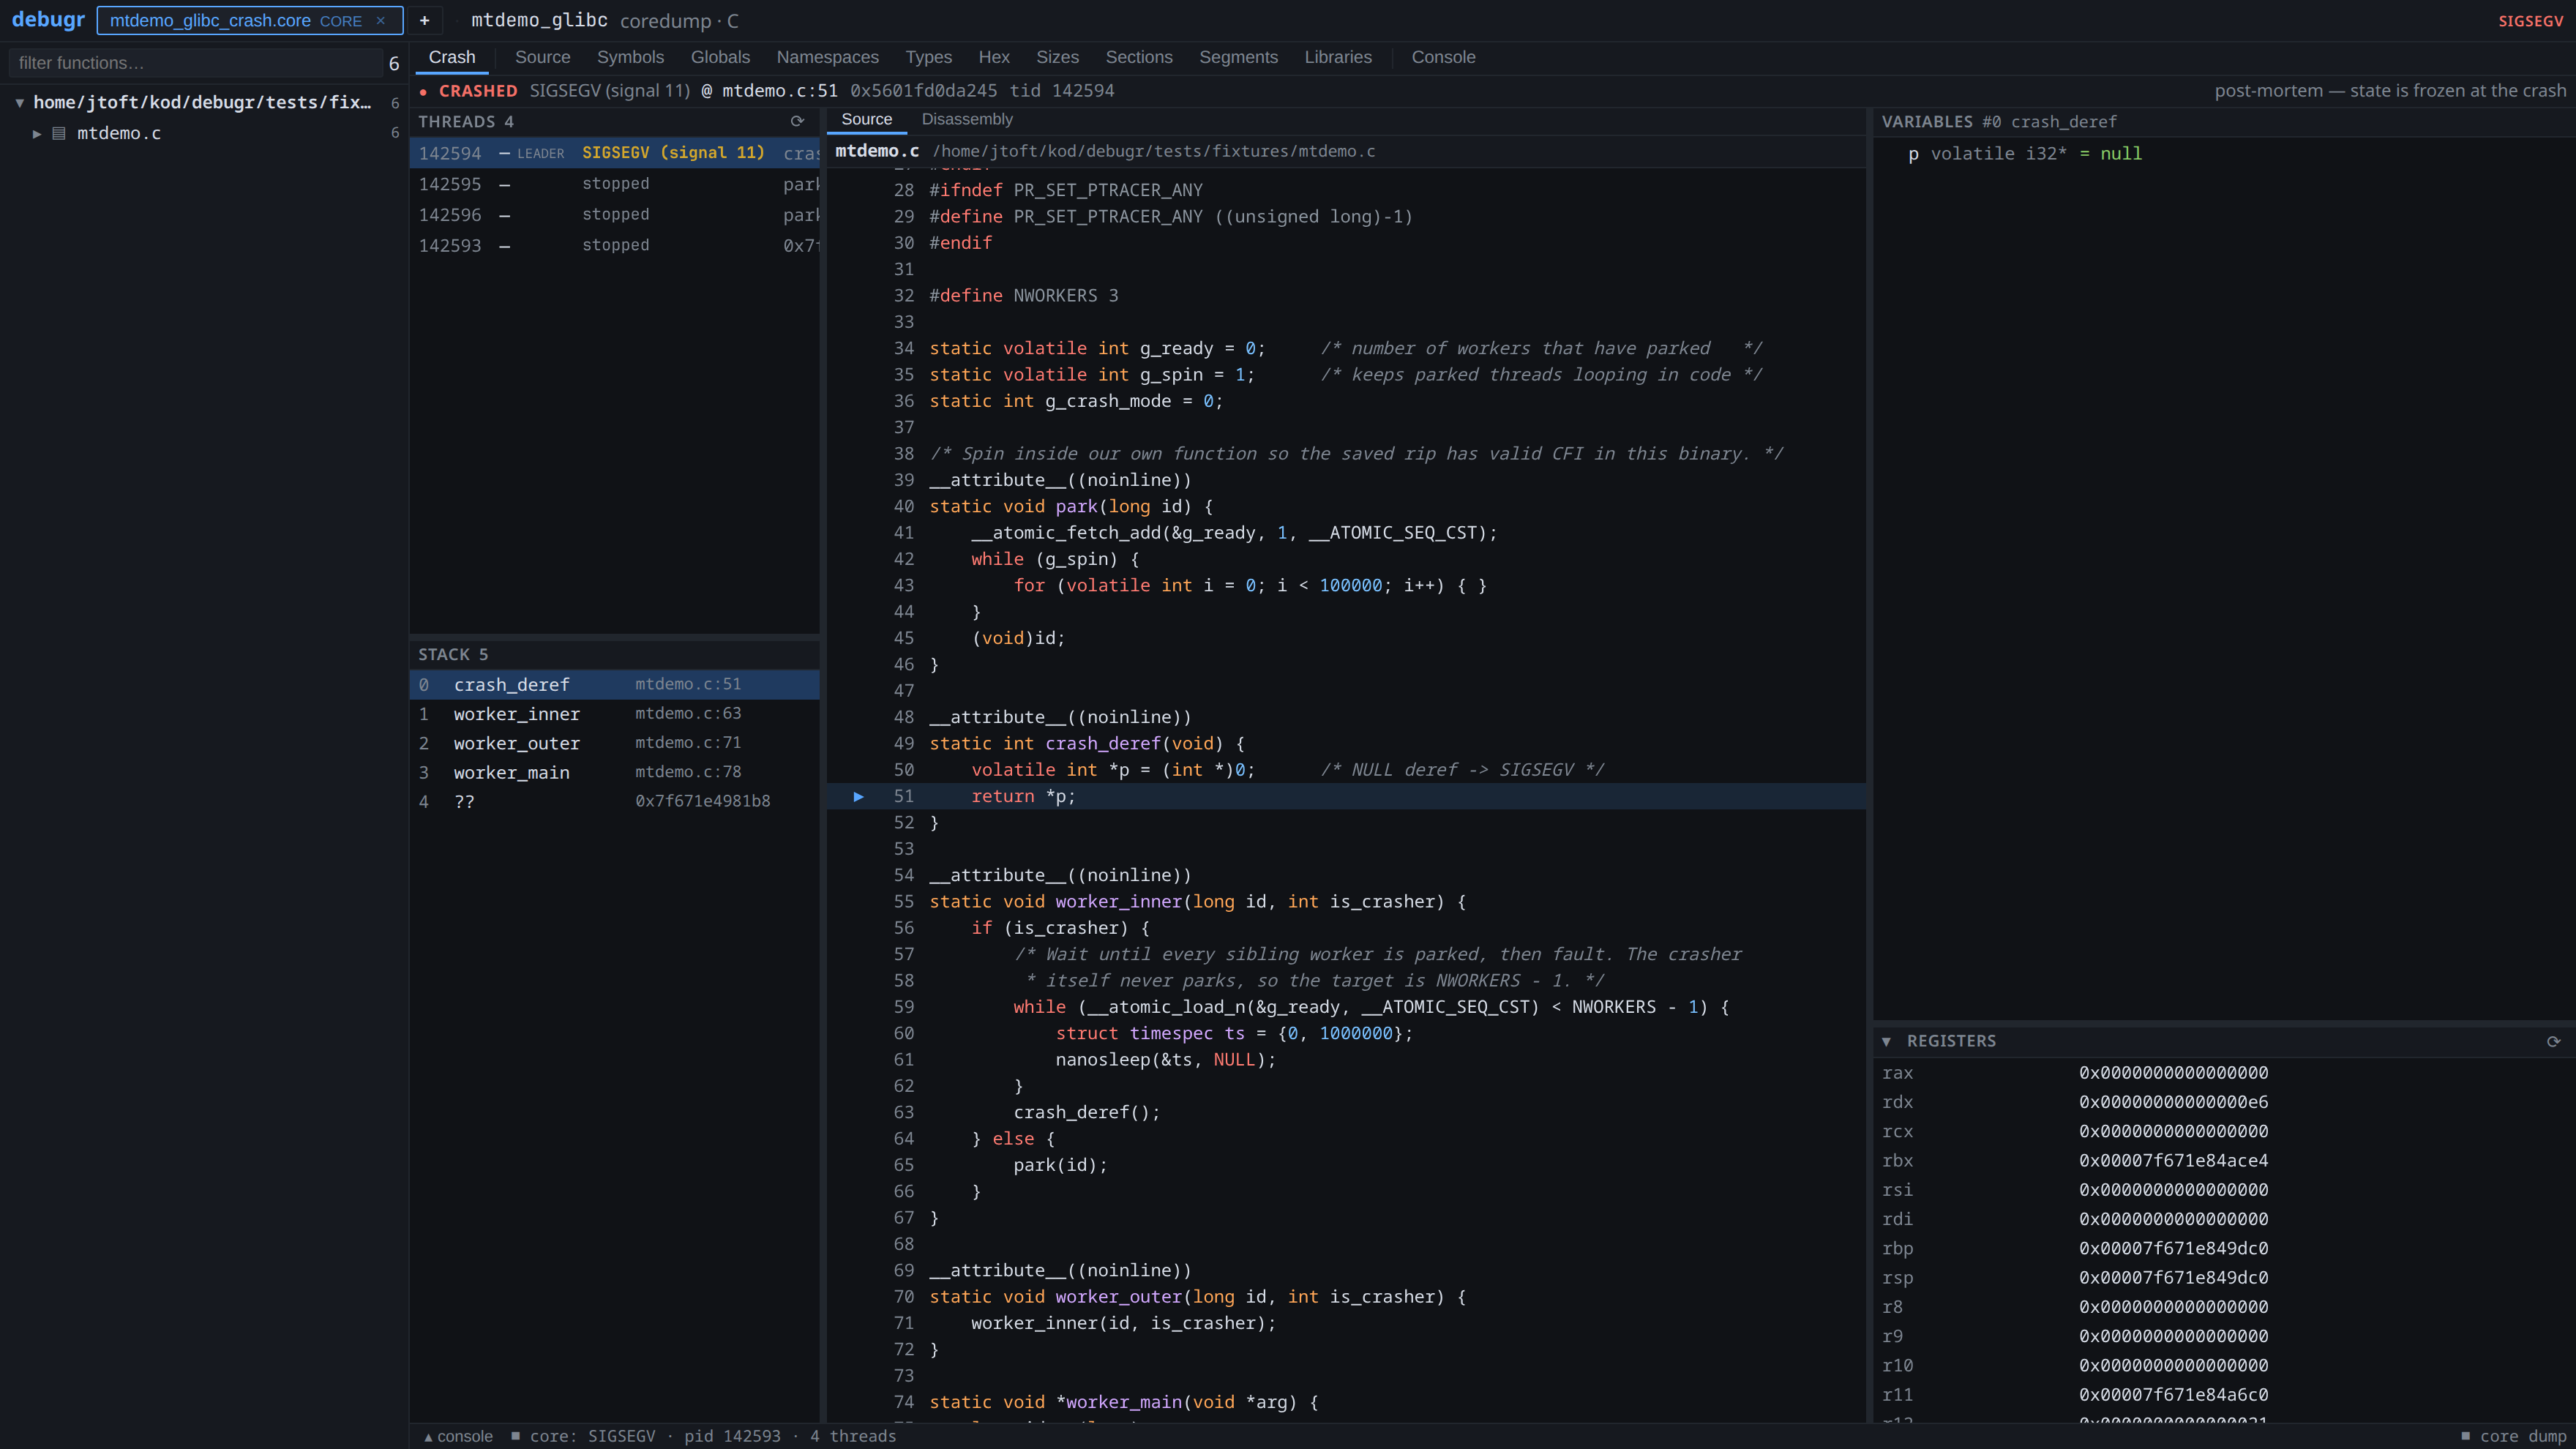
Open the core dump, get the whole debugger
A core dump is just a permanently-stopped process, so it gets the full workbench: source
arrowed at the faulting line, the crash chain click-through, and locals evaluated from the
frozen stack — the variables panel shows the murder weapon,
p volatile i32* = null. Cross-architecture cores work too.
under the hood
Also in the box
- Breakpoints anywhere — main binary or any shared library, with per-module ASLR translation
- Value trees that dereference — pointer previews, string/Vec/glm rendering, cycle-safe
- Honest by design — every rate limit and truncation is counted and shown, never silent
- Rust core — ptrace actor with message-passing concurrency, goblin + gimli, axum server